Analyze

Community Air Pollution Monitoring in Taiwan

tschuetz

From Tu (2020): "In Taiwan, the community air-monitoring projects often have difficulties in identifying the specific pollution sources due to the historical patterns of industrial development that tend to set up dense clusters of different factories in the industrial parks along the west coast (Liu 2012).3 The agglomeration of polluting facilities complicates pollution identification that further creates significant knowledge gaps between the predicted emission, the actual emission, and the community sensory experiences throughout the policy process. This pattern of development has somehow constrained Taiwan community air monitoring to target the specific polluters."

LDEQ in the Media

Lauren
Annotation of

The agency is widely criticized as biased by environmental groups within the Parishes. Conflicts of interest have been cited due to the way in which the department generates funds and can expedite permit approvals. In ProPublica articles, the DEQ has been criticized for non-enforcement against polluting industries and doubting EPAs monitoring. https://www.propublica.org/article/in-cancer-alley-toxic-polluters-face-little-oversight-from-environmental-regulators#:~:text=Series%3A%20Polluter's%20Paradise-,In%20%E2%80%9CCancer%20Alley%2C%E2%80%9D%20Toxic%20Polluters%20Face%20Little%20Oversight%20From,the%20chemical%20industry%20it%20regulates.

Most recently, the EPA is pursuing litigation against LDEQ and Louisiana Department of Health alleging that the LDEQ discriminates on the basis of race, violating Title VI of the Civil Rights Act. Complaints filed on behalf of the Sierra Club, Concerned Citizens of St. Johns, Rise St. James, Louisiana Bucket Brigade and others are in regards to the LDEQ air pollution control programs and permitting that subjects residents on the basis of race, and that the failures to protect the health, disproportionately impact the minority communities, subjecting them to adverse health and environmental impacts.

The LDEQ has been critized for favoring industry, economic and business interests over public welfare. The DEQ has been cited as weighing the creation of jobs and land development over the air and communities being polluted. 

Conflicts of interests have been noted through the DEQ expidited permit reviewal process that approves the siting of petrochemical facitilies. If companies want to expidite the permitting process they must pay the DEQ employees overtime. Conflicts of interest have been noted in the structural process of permitting approvals in which the companies pay the regulators that approve them. 

LDEQ Organizational Structure

Lauren
Annotation of

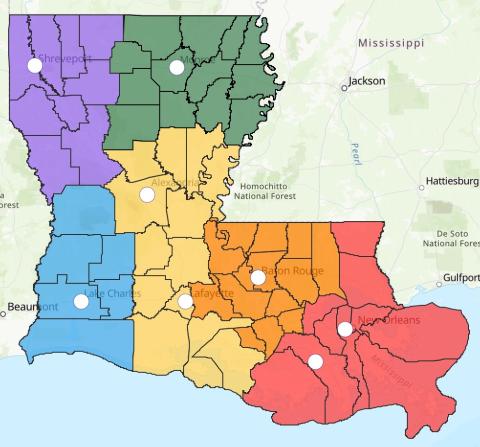
The LDEQ consists of five major offices: Office of the Secretary, Office of Management and Finance, Office of Environmental Services, Office of Environmental Compliance, and Office of Environmental Assessment. The Office of Environmental Services is in charge of Air, Waste and water permits. The Office of Environmental Compliance works on surveillance and enforcement. There are multiple regional offices, 8 (shown below in added image), that serve the Parishes. Currently, as of April 2022, Chuck Carr Brown Serves as Secretary.

Image
LDEQ Regional Offices

LDEQ Funding

Lauren
Annotation of

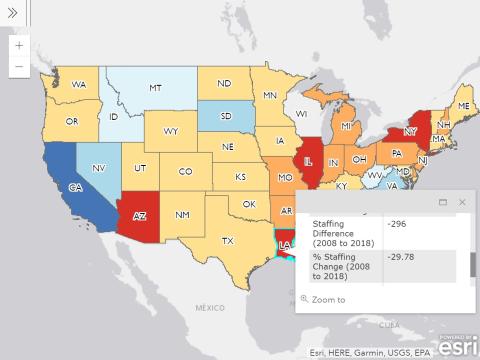
The LDEQ in recent years is underfunded and understaffed compared to previous years. Budget cuts and employee cutbacks are shown through the Environmental Integrity Project Report: During a Time of Cutbacks at EPA, 30 States Also Slashed Funding for State Environmental Agencies. Images below show Louisiana DEQ cutbacks. Red signifies the most cut backs while blue siginifies increased spending or employment by state. 

Image
LDEQ Funding
Image
LDEQ Staffing Changes
   

LDEQ Mission Statement

Lauren
Annotation of

According to the LDEQ Website, “The mission of the Department of Environmental Quality is to provide service to the people of Louisiana through comprehensive environmental protection in order to promote and protect health, safety and welfare while considering sound policies that are consistent with statutory mandates.”

10.What steps does a user need to take to produce analytically sharp or provocative data visualizations with this data resource?

margauxf

Creators of the Student Health Index recommend using the tool in combination with qualitative data collection and stakeholder/community engagement (e.g. working with school leaders, local community leaders, and healthcare providers).

A full guide to using the dashboard is available here.


8. How has this data resource been critiqued or acknowledged to be limited?

margauxf

Data sources utilized by the index are not always the most current due to data collection limitations (e.g. covid-19 has caused disruptions in the collection of CDE data).

The Index is limited in that it does not offer data for schools that were not large enough to warrant the construction of a School-based Health Center. Thus, schools that did not meet specific enrollment targets were excluded from the dashboard. This includes rural schools (designed as such by the USDA) with an enrollment under 500 students, urban schools (without a high school) with less than 500 students, and urban schools (with a high school) with less than 1000 students. California had more than 10,000 active public schools in 2020-21. The final dashboard for the Student Health Index includes 4,821 schools.

The lack of available data on health indicators at a school-level restricted the Student Health Index to using proxies for the health outcomes. Some health indicators are included, but they are not school-specific, instead linked to specific schools geographically through the census tract. However, community-level data does not always accurately reflect the characteristics of a school’s population. As a result, school-level indicators in the Index were weighted more heavily than community-level indicators.

Additionally, race was not included as a measure in the Student Health Index because of California’s Proposition 20, which prohibits the allocation of public resources based on race and ethnicity. However, the dataset does contain measures of non-white students at each school. 

The Index has also been limited as a quantitative measure of need, which may overlook the influence of other factors that might be better illuminated through qualitative evidence (e.g. stakeholder engagement, focus groups, interviews, etc.).