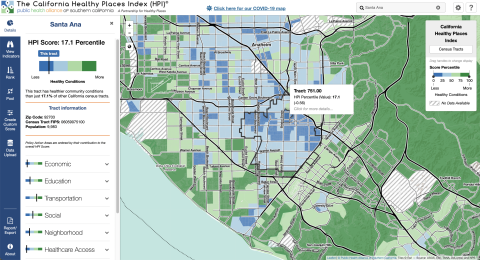
The HPI draws data about 25 community characteristics into a single indexed HPI score. The includes sub-scores for 8 “Policy Action Areas”: Economic, Education, Housing, Health Care Access, Neighborhood, Clean Environment, Transportation, and Social Factors. These scores are meant to be used to evaluate health geographically. Each policy action area includes the following individual indicators and weights:
ECONOMIC (0.32)
EDUCATION (0.19)
- Pre-school enrollment
- High school enrollment
- Bachelors attainment
HEALTHCARE (0.05)
HOUSING (0.05)
- Severe cost burden low income
- Homeownership
- Kitchen and plumbing
- Crowding
NEIGHBORHOOD (0.08)
- Retail jobs
- Supermarket access
- Parks
- Tree canopy
- Alcohol establishments
CLEAN ENVIRONMENT (0.05)
- Diesel PM
- Ozone
- PM2.5
- Drinking water
SOCIAL (0.10)
- Two parent household
- Voting
TRANSPORTATION (0.16)
- Healthy community
- Automobile access
*The steering committee for the HPI sought to include race/ethnicity as a 9th policy action area, but they were prohibited from doing so by state law which does not allow California state agencies to use race as a basis for public contracting.
The primary HPI Index is designed to align with life expectancy at birth as a predictive measure of community health status. However, the Healthy Places mapping tool can also be used to create custom scores using different indicators. The mapping tool includes detailed definitions of each indicator.
Each indicator is linked to a policy guide, which outlines concrete actions (e.g. best practices, emerging policy options) that local jurisdictions can take to improve HPI indicators. These actions are sometimes aimed at addressing direct links between policy and an action area, and other times aimed at addressed the root causes of an action area. The mapping tool also enables filtering results by “Decision support layers” like health outcomes, health risk behaviors, race/ethnicity, climate change effects, and other layers that the alliance identifies as important for advancing “resilient, equitable communities in California”. Geographies (e.g. census tracts) can also be compared by indicator using a ranking tool. The pool function can be used to create customized aggregations of data to map (e.g. adding several census-tracts together).

