Empirical data
Taina Miranda AraujoStudie provides visual representations of lead concentration in Santa Ana cross matching it with vulnerability risk.
Studie provides visual representations of lead concentration in Santa Ana cross matching it with vulnerability risk.
“Also of note when interpreting our results is that this study did not take into consideration the ingestion of heavy metals through the dietary route. Had we considered this additional exposure pathway, our calculated chronic daily intake levels of heavy metals would have been greater, resulting in higher estimated risk (particularly for metals such as Pb, As, and Cd which have been widely documented in various foods)” (Marsi et al. 2021)
“Both cancer and non-cancer risk at the Census tract level exhibited positive correlations with indicators of social as well as physiological vulnerability” (Marsi et al. 2021)
Exposure to heavy metals has been associated with adverse health effects and disproportionately impacts communities of a lower socio-economic status.
This study used a community-based participatory research approach to collect and analyze a large number of randomly sampled soil measurements to yield a high spatially resolved understanding of the distribution of heavy metals in the Santa Ana soil, in an effort to exposure misclassification. This study looks into average metal concentrations at the Census tract level and by land use type, which helps map potential sources of heavy metals in the soil and better understand the association between socioeconomic status and soil contamination (Marsi et al. 2021).
In 2018, soil samples of eight heavy metals including lead (Pb), arsenic (As), manganese (Mn), chromium (Cr), nickel (Ni), copper (Cu), cadmium (Cd), and zinc (Zn) were collected across Santa Ana. These were analyzed at a high resolution using XRF analysis. Then, metal concentrations were mapped out and American Community Survey data was used to assess the metals throughout Census tracts in terms of social and economic variables. Risk assessment was conducted to evaluate carcinogenic risk. The results of the concentrations of soil metals were categorized according to land-use type and socioeconomic factors. “Census tracts where the median household income was under $50 000 had 90%, 92.9%, 56.6%, and 54.3% higher Pb, Zn, Cd, and As concentrations compared to high-income counterparts” (Marsi et al. 2021). All Census tracts in Santa were above hazard inder >1, which implies non-carcinogenic effects, and almost all Census tracts showed a cancer risk above 104, which implies greater than acceptable risk. Risk was found to be driven by childhood exposure.
It was concluded that the issue of elevated soil contamination relates back to environmental justice due to overlap between contaminated areas and neighborhoods of lower socioeconomic status. Marsi et al. (2021) found there needs to be more community-driven recommendations for policies and other actions to address disproportionate solid contamination and prevent adverse health outcomes.
Published in May 2021, amid the coronavirus pandemic where in-person community workshops and meetings turned into weekly virtual meetings.
-> Authors:
Shahir Masri: Department of Environmental and Occupational Health, Program in Public Health, University of California, Irvine; air pollution scientist.
Alana M. W. LeBrón: Department of Health, Society, and Behavior, University of California, Irvine; Assistant Professor, Chicano/Latino Studies; Interests: structural racism and health, health of Latina/o communities, community-based participatory research.
Michael D. Logue: Department of Chicano/Latino Studies, University of California, Irvine
Enrique Valencia: Orange County Environmental Justice, Santa Ana
Abel Ruiz: Jóvenes Cultivando Cambios, Santa Ana; CRECE Urban Farming Cooperative member
Abigail Reyes: Community Resilience, University of California, Irvine
Jun Wu: Department of Environmental and Occupational Health, Program in Public Health, University of California, Irvine
There are missing data points within the dataset (attributed to non-reported information). This dataset has also been acknowledged to be limited in its prioritization of government data, which could have political limitations that may skew the degree of severity for disasters reported.
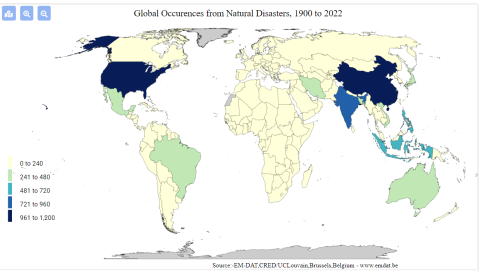
This dataset can be used to demonstrate the geographic distribution of disasters in Vietnam over time. This database recognizes multiple dimensions of disaster, including natural (typhoons, hurricanes), technological (a chemical spill, a factory explosion), and more

This dataset includes information at the country and regional level. Reports of disasters, both natural and human-related, are recorded at the country and province, region, or city level.
This resource has been used in a publication written by Hoang et al., 2018 on the economic cost of the Formosa Toxic Waste Disaster in Central Vietnam. It is specifically used within the journal article to highlight the forms in which disasters can take place within a nation, and the rising cases of industrial disasters that have afflicted vulnerable communities within the last decade. This characterization sets the stage and context for the Formosa disaster, and integrates it within a wider conversation about the effects of intensified industrialization on the environment.
These datasets all involve a strong spatial component. The presentation of such data could best be done via GIS Software, with their integration within a story map to demonstrate the importance of environmental stewardship to natural environments as well as the people who depend on such resources for their livelihoods. For example, EPI data can be incorporated with EM-DAT’s disaster data to better understand the relationship between a country’s EPI performance and the amount of technological disasters it observes. A country’s EPI score on Fish Stock Status can be compared with how much the nation’s GDP relies on fisheries to draw attention to discrepancies between stewardship and a country’s reliance on this resource. This process will require a user to be familiar with GIS Software and spatial plotting of data points (as the datasets themselves have not been integrated into ArcGIS), and using this software to integrate information together into meaningful maps.