Analyze

Austin, Texas

Misria

The political process is also always a learning process, a process of attunement. And becoming attuned to relations of power also means becoming compromised, to a certain degree, despite whether this attunement takes the form of compliance or resistance. For instance, the oil and gas industry has had a large influence on the structure and character of renewable energy advocacy in Austin, Texas, even as it was being developed as a strategy of resistance to petroculture. In particular, there was the purposeful move to imitate the mineral rights contracts that the oil and gas industry had developed in order to drill on private land, creating similarly structured leasing agreements for what would come to be known as “wind farms” in many of the same locations as former drilling sites. The idea here was to create a wealthy landowning class that could help lobby for renewable energy, much like previous land owners had for the oil and gas industry. Secondly, the Texas Renewable Energy Industry Association (TREIA) collectively decided to invite the utility industry to join their ranks in order to pursue renewable energy at the utility scale through the use of Renewable Portfolio Standards. And while Austin’s early energy advocates still speak of this as a winning strategy (and indeed it was), it also reproduced the utility as a center of power and promoted a top-down style of environmental advocacy that had long shut Austin's minoritized and marginalized communities out of its environmental benefits. Building support in this way, by appealing to those who are not only likely to share your perspective and its blindspots, but that have also already shaped the political landscape in their interest, this creates the perfect conditions for injustices to transpire, persist, and even intensify. Thus, part of the struggle for just transition entails keeping the question of what counts as environmental justice or injustice held open at the same time that the former is being pursued and/or the latter resisted. 

Adam, James. 2023. "Petro-ghosts." In 4S Paraconference X EiJ: Building a Global Record, curated by Misria Shaik Ali, Kim Fortun, Phillip Baum and Prerna Srigyan. Annual Meeting of the Society of Social Studies of Science. Honolulu, Hawai'i, Nov 8-11.

尋找一個叫做家的地方

janey7875

我訪問到的阿嬤也有在高度人力密集的產業中工作過,如餐飲、紡織等等,反映了當代大環境中原民來到都市的處境。都市原民作為台灣產業發展的推手之一,卻無法擁有安身立命的家,而被迫在各處流浪,直到近代才開啟了與政府溝通的橋樑,卻依然有種種難題需要克服。

Ocean in Amis culture

sharonku

Did you scan the photos and write down the lyrics?

These are important artifacts that carries memories and stories belong to the grandma and her generation, for instance, their relationship with the ocean, fishery and seafood, etc. 

https://ubrand.udn.com/ubrand/story/12116/4095581

How do they maintain such relationship in the urban setting? What is the meaning of sea to them after living in Hsinchu for decades? Do they feel the difference between the sea in Hsinchu and inTaidung? Why?

1. WHAT IS THIS DATA RESOURCE CALLED AND HOW SHOULD IT BE CITED?

margauxf

Public Health Alliance of Southern California. California Healthy Places Index. 2019. https://healthyplacesindex.org.


© 2018 Public Health Alliance of Southern California

Permission is hereby granted to use, reproduce, and distribute these materials for noncommercial purposes, including educational, government and community uses, with proper attribution to the Public Health Alliance of Southern California including this copyright notice. Use of this publication does not imply endorsement by the Public Health Alliance of Southern California.

© 2018 California Department of Public Health (CDPH)

Permission is hereby granted to use, reproduce, and distribute these materials for noncommercial purposes, including educational, government, and community uses, with proper attribution to the CDPH, including this copyright notice. Use of this publication does not imply endorsement by the CDPH.

8. How has this data resource been critiqued or acknowledged to be limited?

margauxf

The index does not include certain neighborhood characteristics critical to health because they did not meet the criteria for inclusion (described in question 3). For instance, this included physician ratios (the number of physicians per 100,000 population) because data was missing for a majority of census tracts. In fact, the steering committee was unable to locate much data on health care access or quality at the census-tract level (only data on health care insurance coverage was available).  

 The index was previously critiqued in ways that led to a shift from framing data in terms of “disadvantage” towards a framework of “opportunity”. This led to not only a renaming of the index (from “the Health Disadvantage Index to the Healthy Places Index) but also a shift in reporting of data (e.g. highlight the percentage of the population with a BA degree or higher rather than the percentage of population without a college degree). 

The HPI is also limited in terms of the effects of confounding, with some indicators with strong evidence of health effects showing contrary associations with life expectancy at birth by census tract. The steering committee has also acknowledged that the HPI might not be accurate for census tracts undergoing rapid population change (e.g. due to immigration, rapid gentrification, or other changes).

The HPI notably does not correlate strongly with CalEnviroScreen, which the steering committee for the HPI noted failed to identify one-third of census tracts with the worst conditions for population health. The HPI is ultimately more centered on considering environmental factors as a part of overall health, rather than as a central determinant. However, this disconnect between CalEnviroScreen and the HPI may also be a reflection of the challenges environmental injustice advocates have faced in linking environmental factors to health outcomes (which might not be as visible and geographically direct as the links between health and other indicators).

5. What can be demonstrated or interpreted with this data set?

margauxf

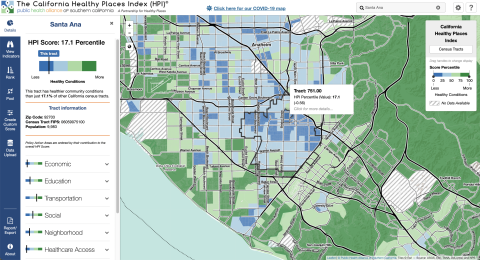
The HPI draws data about 25 community characteristics into a single indexed HPI score. The includes sub-scores for 8 “Policy Action Areas”: Economic, Education, Housing, Health Care Access, Neighborhood, Clean Environment, Transportation, and Social Factors. These scores are meant to be used to evaluate health geographically. Each policy action area includes the following individual indicators and weights:

ECONOMIC (0.32)

  • Poverty
  • Employment
  • Income

EDUCATION (0.19)

  • Pre-school enrollment
  • High school enrollment
  • Bachelors attainment

HEALTHCARE (0.05)

  • Insured adults

HOUSING (0.05)

  • Severe cost burden low income
  • Homeownership
  • Kitchen and plumbing
  • Crowding

NEIGHBORHOOD (0.08)

  • Retail jobs
  • Supermarket access
  • Parks
  • Tree canopy
  • Alcohol establishments

CLEAN ENVIRONMENT (0.05)

  • Diesel PM
  • Ozone
  • PM2.5
  • Drinking water

SOCIAL (0.10)

  • Two parent household
  • Voting

TRANSPORTATION (0.16)

  • Healthy community
  • Automobile access

*The steering committee for the HPI sought to include race/ethnicity as a 9th policy action area, but they were prohibited from doing so by state law which does not allow California state agencies to use race as a basis for public contracting.


The primary HPI Index is designed to align with life expectancy at birth as a predictive measure of community health status. However, the Healthy Places mapping tool can also be used to create custom scores using different indicators. The mapping tool includes detailed definitions of each indicator.

Each indicator is linked to a policy guide, which outlines concrete actions (e.g. best practices, emerging policy options) that local jurisdictions can take to improve HPI indicators. These actions are sometimes aimed at addressing direct links between policy and an action area, and other times aimed at addressed the root causes of an action area. The mapping tool also enables filtering results by “Decision support layers” like health outcomes, health risk behaviors, race/ethnicity, climate change effects, and other layers that the alliance identifies as important for advancing “resilient, equitable communities in California”. Geographies (e.g. census tracts) can also be compared by indicator using a ranking tool. The pool function can be used to create customized aggregations of data to map (e.g. adding several census-tracts together).

4. What scales (county, regional, neighborhood, census tract) can be seen through this data resource?

margauxf

Data is available at several different scales: census-tracts, congressional districts, state assembly districts, state senate districts, cities, core based statistical areas, elementary school districts, metropolitan planning organization and medical service study areas.  

10. What steps does a user need to take to produce analytically sharp or provocative data visualizations with this data resource?

margauxf

Creating maps by different combinations of indicators or geographic aggregations could be tinkered with to produce provocative data visualizations. Ranking scores can be used to draw distinction between different census tracts. However, clear inequities are evident even without these adjustments, with the HPI index score clearly demonstrating noticeable differences across geographies. 

2. Who makes this data available and what is their mission?

margauxf

The California Healthy Places Index is made available by the Public Health Alliance of Southern California. Their mission is to “make health equity and racial justice a reality” through collaboration and data (https://www.thepublichealthalliance.org/). They engage in advocacy and mobilization to generate this change. They are composed of a coalition of executives representing 10 local health jurisdictions in Southern California (including Long Beach, Los Angeles, Orange, and Riverside, among others), an area they highlight as representing 60% of California’s population (with which they blur the boundaries between “California” and “Southern California”).

The alliance emphasizes pursuing equity using publicly available data and collaboration (with government agencies, legislators, hospitals, health plans, philanthropy, and community advocates). They present the Healthy Places Index (HPI) as a tool for exploring how life expectancy is impacted by community conditions.

More specifically, the HPI was created by a steering committee made up of epidemiologists and 3 public health coalitions led by the alliance.