Analyze

Central Valley, California

Misria

California’s Central Valley is arguably the most productive agricultural region in the world. Despite making up only 1% of all farmland in the United States, it produces 250 different crops that make up a quarter of all food consumed in the U.S., including close to half of all fruit, nuts, and table foods. The map included below shows the variety and intensity of this kind of cultivation. This level of agricultural production has been made possible by the dominance of industrial agriculture interests at all levels of government, resulting in one of the most physically altered landscapes in the world. These alterations focused in large part on water, the biggest limiting factor for industrial agriculture in a region technically classified as a desert. Over the course of the 20th century, the largest body of freshwater west of the Mississippi–Tulare Lake–was drained to make more land available, the Central Valley Project and State Water Project built thousands of miles of canals and tens of dams to control the supply of water for irrigation, and massive groundwater aquifers were pumped nearly dry during drought years. These transformations were accomplished through the utilization of rhetoric that emphasizes the centrality of the farmer identity to the American political imaginary (despite the massive distance between Californian industrial agriculture and the Jeffersonian agrarian ideal) and the unique importance of providing the nation’s food. This kind of exceptionalism has characterized agriculture across the United States since its inception and has repeatedly produced other forms of social injustice (e.g., the exclusion of agricultural laborers from U.S. labor protections) that compound the hazardous effects of its environmental injustices.

Source

Vo, Katie, Taranjot Bhari and Margaret Tebbe. 2023. Industrial Agriculture in California's Central Valley. In 4S Paraconference X EiJ: Building a Global Record, curated by Misria Shaik Ali, Kim Fortun, Phillip Baum and Prerna Srigyan. Annual Meeting of the Society of Social Studies of Science. Honolulu, Hawai'i, Nov 8-11.

Central Valley, California

Misria

California’s Central Valley is arguably the most productive agricultural region in the world. Despite making up only 1% of all farmland in the United States, it produces 250 different crops that make up a quarter of all food consumed in the U.S., including close to half of all fruit, nuts, and table foods. The map included below shows the variety and intensity of this kind of cultivation. This level of agricultural production has been made possible by the dominance of industrial agriculture interests at all levels of government, resulting in one of the most physically altered landscapes in the world. These alterations focused in large part on water, the biggest limiting factor for industrial agriculture in a region technically classified as a desert. Over the course of the 20th century, the largest body of freshwater west of the Mississippi–Tulare Lake–was drained to make more land available, the Central Valley Project and State Water Project built thousands of miles of canals and tens of dams to control the supply of water for irrigation, and massive groundwater aquifers were pumped nearly dry during drought years. These transformations were accomplished through the utilization of rhetoric that emphasizes the centrality of the farmer identity to the American political imaginary (despite the massive distance between Californian industrial agriculture and the Jeffersonian agrarian ideal) and the unique importance of providing the nation’s food. This kind of exceptionalism has characterized agriculture across the United States since its inception and has repeatedly produced other forms of social injustice (e.g., the exclusion of agricultural laborers from U.S. labor protections) that compound the hazardous effects of its environmental injustices.

Vo, Katie, Taranjot Bhari and Margaret Tebbe. 2023. "Industrial Agriculture in California's Central Valley." In 4S Paraconference X EiJ: Building a Global Record, curated by Misria Shaik Ali, Kim Fortun, Phillip Baum and Prerna Srigyan. Annual Meeting of the Society of Social Studies of Science. Honolulu, Hawai'i, Nov 8-11.

What quotes from this text are exemplary or particularly evocative?

annika

“...Toxic Wastes and Race at Twenty (Bullard et al., 2007) revealed that communities of colour and poor communities were still being used as dumping grounds for all kinds of toxic contaminants. The authors discovered evidence that the clustering of environmental hazards, in addition to single sources of pollution, presented significant threats to communities of colour. Furthermore, the research showed that polluting industries frequently singled out communities of colour in siting decisions, countering the “minority move-in hypothesis”: the claim that people of colour voluntarily move into contaminated communities rather than being targeted in situ by dirty industries.” (122)


“Bullard (1990) has highlighted the problem of “Black Love Canals” throughout the United States, where issues of environmental injustice are deeply connected with environ- mental racism. For example, Bullard highlights the case of toxic DDT water contamination in the African American community of Triana, Alabama. In 1978, in the midst of the national media attention focused on Love Canal, residents in Triana raised complaints over ill-health effects and contaminated fish and waterfowl. Lawsuits in Triana against the Olin Corporation continued throughout the 1980s. Although the case is noted within environ- mental justice histories (see Taylor, 2014), it is not widely recognized or commemorated.” (126)


“Underpinning the slow, structural violence (see Galtung, 1969; Davies, 2019) of unequal and unjust toxic exposures is the problem of “expendability” … Pellow (2018) proposes that indispensability is a key pillar of critical environmental justice studies (alongside intersectionality, scale, and state power). This idea builds on the work of critical race and ethnic studies scholar John Marquez (2014) on “racial expendability” to argue that, within a white-dominated society, people of colour are typically viewed as expendable.” (127)

“National and international media headlines followed the Flint water crisis story as it unfolded, but, after the initial shock, Flint faded from media attention. It shifted from being a spectacular disaster to a case of slow violence. This paral- lels the dynamics of public memory surrounding many toxic disasters, struggles, and legacies.” (128)

What is the main argument, narrative and effect of this text? What evidence and examples support these?

annika

The author’s main argument is two-fold. Acute environmental disasters (e.g., Chernobyl, BP Horizon Spill, Hurricane Katrina) that garnered public attention leave behind legacies of increased support for environmental action and legislation, although the public attention span is often too short for lasting change. At the same time, these disasters have received a disproportionate amount of public attention compared to the many more slow-moving toxicity disasters that affect people in more systematic but often less visible ways. Examples of this disparity include the contrast between the 1984 Bhopal disaster coverage, and the persistent toxicity in the area in the time since then in the form of industrial waste and infrastructure that is not maintained. It is additionally important to note that the cases that don’t receive much attention often affect marginalized groups (by race, socioeconomics) disproportionately.

9. How has this data resource been critiqued or acknowledged to be limited?

annlejan7

There are missing data points within the dataset (attributed to non-reported information). This dataset has also been acknowledged to be limited in its prioritization of government data, which could have political limitations that may skew the degree of severity for disasters reported. 

8. What can be demonstrated or interpreted with this data set?

annlejan7

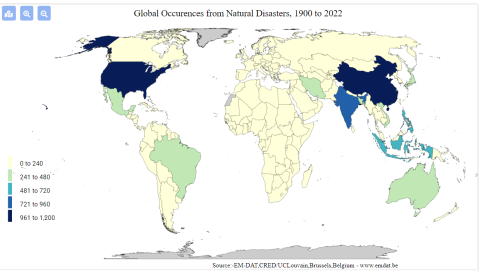
This dataset can be used to demonstrate the geographic distribution of disasters in Vietnam over time. This database recognizes multiple dimensions of disaster, including natural (typhoons, hurricanes), technological (a chemical spill, a factory explosion), and more

Image
screenshot_2022-02-22_171315.png
complex disasters such as famine.

6. How has this data resource been used in research and advocacy?

annlejan7

This resource has been used in a publication written by Hoang et al., 2018 on the economic cost of the Formosa Toxic Waste Disaster in Central Vietnam. It is specifically used within the journal article to highlight the forms in which disasters can take place within a nation, and the rising cases of industrial disasters that have afflicted vulnerable communities within the last decade. This characterization sets the stage and context for the Formosa disaster, and integrates it within a wider conversation about the effects of intensified industrialization on the environment. 

5. What steps does a user need to take to produce analytically sharp or provocative data visualizations with this data resource?

annlejan7

These datasets all involve  a strong spatial component. The presentation of such data could best be done via GIS Software, with their integration within a story map to demonstrate the importance of environmental stewardship to natural environments as well as the people who depend on such resources for their livelihoods.  For example, EPI data can be incorporated with EM-DAT’s disaster data to better understand the relationship between  a country’s EPI performance and the amount of technological disasters it observes. A country’s EPI score on Fish Stock Status can be compared with how much the nation’s GDP relies on fisheries to draw attention to discrepancies between stewardship and a country’s reliance on this resource. This process will require a user to be familiar with GIS Software and spatial plotting of data points (as the datasets themselves have not been integrated into ArcGIS), and using this software to integrate information together into meaningful maps.

4. What data visualizations illustrate how this data set can be leveraged to characterize environmental injustice?

annlejan7

[Source: EM-DAT Public] This graphic shows the prevalence of technological disasters [includes toxic spills, industrial explosions, etc.] by country. This can be used to characterize, on a transnational level, where potential industrial harms are centralized or concentrated. While it does not characterize more insidious harms, such as air pollution, it can be a direct and easy to understand measure of environmental harm distribution across the globe. 

Additionally, data is available as excel sheets, which allows users to produce their own graphics on the prevalence of disasters within a particular nation over a desired time interval.