Analyze

What can be demonstrated or interpreted with this data set?

albrowne

What this lacks in visualizations it makes up for drastically in easy to use UI and for creating one location for all of the state's facility data. By using its advanced search tool users can quickly find a plethora of data on extremely specific sites. This tool will show when the facilities had their most recent evaluations and whether or not there were violations, rough estimates on onsite stored chemicals, which regulatory programs they are a part of, CalEnviroScreen percentile ranges, and a contact list for facility employees.

5. What can be demonstrated or interpreted with this data set?

margauxf

The Student Health Index enables users to identify where SBHCs will have the most impact for students. The index uses 12 indicators, each of which can be scored from 1 to 4 for any given school. These scores are generated using percentiles and represent relative values. The 12 indicator scores are combined into a Need Score, which is calculated using percentiles along a scale of 1 to 4. Schools with a score of 4 (in the 4th quartile) have the highest Need scores relative to other schools in California.

The index is composed of 12 diverse indicators (percentages, rates, and index values) that have been transformed using percentiles in order to enable comparisons on a common scale. These indicators are divided into 3 categories: health indicators, school-level indicators, and socioeconomic indicators.


Health Indicators

  1. Diabetes
  2. Asthma ED admissions
  3. Teen birth
  4. Health Professional Shortage Areas (HPSA)


Socioeconomic Indicators

  1. Poverty among individuals under 18
  2. Uninsured among under 19
  3. Healthy Places Index


School-Level Indicators

  1. Percent FRPL (students eligible for free or reduced-price meals)
  2. Percent English Learners
  3. Percent Chronically Absent
  4. Percent experiencing homelessness
  5. Suspension rate


Other Data

  1. Mental health hospitalization rate
  2. Percent in foster care


Indicator selection was guided by CDC estimations on the primary contributing factors that shape health (social determinants of health, medical care, and health behaviors). The indicators included in the index are all either directly associated with the absence of health services that could be provided at a school level, act as proxies for health behaviors, or represent social determinants of health that could be addressed through access to school-based health services.

Indicator selection was influenced by recommendations from the Research Initiative of the Campaign for Educational Equity at Columbia Teachers College, which found that seven health disparities affecting school-aged youth could be addressed through school health programs. These disparities include: (1) vision, (2) asthma, (3) teen pregnancy, (4) aggression and violence (including bullying), (5) physical activity, (6) hunger, and (7) inattention and hyperactivity.

More detailed description of the rationale shaping indicator selection is available here.


8. What can be demonstrated or interpreted with this data set?

annlejan7

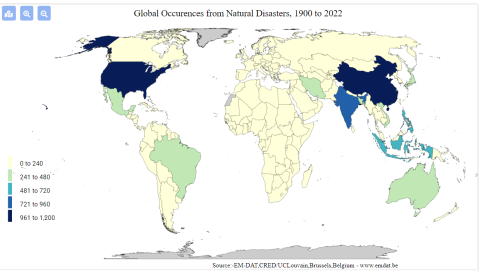
This dataset can be used to demonstrate the geographic distribution of disasters in Vietnam over time. This database recognizes multiple dimensions of disaster, including natural (typhoons, hurricanes), technological (a chemical spill, a factory explosion), and more

Image
screenshot_2022-02-22_171315.png
complex disasters such as famine.

5. What can be demonstrated or interpreted with this data set?

margauxf

The CDC/ADSDR SVI is designed to help public health officials and local planners with preparing and responding to emergency events like hurricanes, disease outbreaks, or exposure to dangerous chemicals. The SVI databases and maps can be used to estimate the amount of supplies need (e.g. food, water, medicine, etc.), to identify areas in need of emergency shelters, to estimate the number of emergency personnel need, to create evacuation plans, and to “identify communities that will need continued support to recover following an emergency or natural disaster” (https://www.atsdr.cdc.gov/placeandhealth/svi/fact_sheet/fact_sheet.html).

The SVI determines the social vulnerability of every census tract in the United States. The index ranks each tract on 15 factors grouped into four related themes (see below).

Each census tract/county has a percentile ranking that represents the proportion of tracts/counties for which the tract/county of interest is equal to or lower in terms of social vulnerability. Higher percentile ranking values indicate greater vulnerability. For instance, ranking of 0.85 indicates that the tract/county of interest is more vulnerable than 85% of tracts/counties but less vulnerable than 15% of tracts/counties.

The CDC defines social vulnerability as the extent to which certain social conditions might affect a community’s capacity to respond to a disaster and prevent human suffering and financial loss.

Starting in 2014, the CDC has also added a database for Puerto Rice, as well as for Tribal Census Tracts, which are defined independently of standard county-based tracts.

Overall Vulnerability

1. Socioeconomic Status

  • Below Poverty
  • Unemployed
  • Income
  • No High School Diploma

2. Household Composition and Disability

  • Aged 65 of Older
  • Aged 17 or Younger
  • Civilian with a Disability
  • Single-Parent Household

3. Minority Status and Language

  • Minority
  • Speaks English “Less than Well”

4. Housing Type and Transportation

  • Multi-Unit Structures
  • Mobile Homes
  • Crowding
  • No Vehicle
  • Group Quarters

In 2018, two adjunct variables (not included in the overall SVI rankings) were added: 2014-2018 ACS estimates for persons without health insurance, and an estimate of daytime population taken from LandScan 2018.

5. What can be demonstrated or interpreted with this data set?

margauxf

The PVI offers a visual synthesis of information to monitor disease trajectories, identify local vulnerabilities, forecast outcomes, and guide an informed response (e.g. allocating resources). This includes short-term, local predictions of cases and deaths. The PVI dashboard creates profiles (called PVI scorecards) for every county in the United States.

The PVI dashboard can be customized to specific needs by adding or removing layers of information, filtering by region, or clustering by profile similarity. The Predictions panel connects historical tracking to local forecasts of cases and deaths. The dashboard applies an integrated concept of vulnerability composed of both dynamic (infection rate and interventions) and static (community population and health care access) factors.

The statistical modeling supporting the PVI dashboard (generalized linear models of cumulative outcome data) has indicated that following population size, the most significant predictors of cases and deaths were the proportion of Black residents, mean fine particulate matter [particulate matter ≤2.5μm in diameter (PM2.5)], percentage of population with insurance coverage, and proportion of Hispanic residents.

The ToxPi*GIS framework, from which the PVI was built, is a free tool that integrates data streams from different sources into interactive profiles that overlay geographic information systems (GIS) data. This enables people using the tool to compare, cluster, and evaluate the sensitivity of a statistical framework to component data streams. In other words, this enables the integration of data that are not normally compared (data are combined into a matrix comprised of various domains or categories, varying weights and represented by color schemes).

5. What can be demonstrated or interpreted with this data set?

margauxf

The HPI draws data about 25 community characteristics into a single indexed HPI score. The includes sub-scores for 8 “Policy Action Areas”: Economic, Education, Housing, Health Care Access, Neighborhood, Clean Environment, Transportation, and Social Factors. These scores are meant to be used to evaluate health geographically. Each policy action area includes the following individual indicators and weights:

ECONOMIC (0.32)

  • Poverty
  • Employment
  • Income

EDUCATION (0.19)

  • Pre-school enrollment
  • High school enrollment
  • Bachelors attainment

HEALTHCARE (0.05)

  • Insured adults

HOUSING (0.05)

  • Severe cost burden low income
  • Homeownership
  • Kitchen and plumbing
  • Crowding

NEIGHBORHOOD (0.08)

  • Retail jobs
  • Supermarket access
  • Parks
  • Tree canopy
  • Alcohol establishments

CLEAN ENVIRONMENT (0.05)

  • Diesel PM
  • Ozone
  • PM2.5
  • Drinking water

SOCIAL (0.10)

  • Two parent household
  • Voting

TRANSPORTATION (0.16)

  • Healthy community
  • Automobile access

*The steering committee for the HPI sought to include race/ethnicity as a 9th policy action area, but they were prohibited from doing so by state law which does not allow California state agencies to use race as a basis for public contracting.


The primary HPI Index is designed to align with life expectancy at birth as a predictive measure of community health status. However, the Healthy Places mapping tool can also be used to create custom scores using different indicators. The mapping tool includes detailed definitions of each indicator.

Each indicator is linked to a policy guide, which outlines concrete actions (e.g. best practices, emerging policy options) that local jurisdictions can take to improve HPI indicators. These actions are sometimes aimed at addressing direct links between policy and an action area, and other times aimed at addressed the root causes of an action area. The mapping tool also enables filtering results by “Decision support layers” like health outcomes, health risk behaviors, race/ethnicity, climate change effects, and other layers that the alliance identifies as important for advancing “resilient, equitable communities in California”. Geographies (e.g. census tracts) can also be compared by indicator using a ranking tool. The pool function can be used to create customized aggregations of data to map (e.g. adding several census-tracts together).