Search

7. How has this data resource been used in research and advocacy?

margauxf

The SVI has been used to assess hazard mitigation plans in the southeastern US, evaluate social vulnerability in connection to obesity, explore the impact of climate change on human health, create case studies for community resilience policy, and even to look beyond disasters in examining a community’s physical fitness. 

The SVI was also used by public health researchers to explore the association between vulnerability and covid-19 incidence in Louisiana Census Tracts. Previous research examining associations between the CDC SVI and early covid-19 incidence had mixed results at a county level, but Biggs et al.’s study found that all four CDC SVI sub-themes demonstrated association with covid-19 incidence (in the first six months of the pandemic). Census tracts with higher levels of social vulnerability experienced higher covid-19 incidence rates. Authors of this paper point to the long history of racial residential segregation in the United States as an important factor shaping vulnerability and covid-19 incidence along racialized lines, with primarily Black neighborhoods typically most disadvantaged relative to primarily white neighborhoods. The compounding factors shaping vulnerability along racialized lines—high rates of poverty, low household income, and lower educational attainment—are identified as shaping the likelihood of covid-19 infection. The authors encourage policy initiatives that not only mitigate covid-19 transmission through allocation of additional resources and planning, but that also “address the financial and emotional distress following the covid-19 epidemic among the most socially vulnerable populations” (Biggs et al., 2021).

Image
relationship between social vulnerability and covid-19 Louisiana

Biggs, Erin N., Patrick M. Maloney, Ariane L. Rung, Edward S. Peters, and William T. Robinson. 2021. “The Relationship Between Social Vulnerability and COVID-19 Incidence Among Louisiana Census Tracts.” Frontiers in Public Health 8. https://www.frontiersin.org/article/10.3389/fpubh.2020.617976.

Lehnert, Erica Adams, Grete Wilt, Barry Flanagan, and Elaine Hallisey. 2020. “Spatial Exploration of the CDC’s Social Vulnerability Index and Heat-Related Health Outcomes in Georgia.” International Journal of Disaster Risk Reduction 46 (June): 101517. https://doi.org/10.1016/j.ijdrr.2020.101517.

FERC Data and Reports that Support approach to Environmental, health and disaster governance

Lauren
Annotation of

Strategic plans generated every four years include and highlight FERC motivations, goals, and emphasize key priorities the organization plans on focusing on. The newest FERC Strategic plan FY 2022-2026 demonstrates the organizations shifting focus on environmental implications and environmental justice. Compared to the previous Strategic plans from 2009 till 2022, there have been zero mentions of “environmental justice” or “environmental justice communities”. In the newest 2022-2026 strategic plan there were 24 mentions of “environmental justice” and 11 mentions of “environmental justice communities”. The newest strategic plan focuses on better examining greenhouse gas emissions by revising the analytical framework for evaluating effects of natural gas infrastructure. The newest strategic plan includes an outline to address energy security and reliability given extreme weather events, climate change and new cyber security threats. An additional priority includes improving participation in proceedings, including landowners, environmental justice communities, tribal nations, and members of the public. Their report also includes an emphasis on regulation and compliance with industry. 

FERC Funding

Lauren
Annotation of

The structure in which the FERC is funded is one of particular controversy, which was brought to court in 2016 by the Delaware Riverkeeper Network. The DRN alleged that the way in which the FERC was funded was inherently biased in favor of industry and violated the public's 5th amendment right. The FERC has an appropriated budget set by congress. The FERC raises revenue through the industry it regulates to reimburse and generate funding.  The lawsuit legally sided with the FERC giving the following reasons: the FERC budget has remained consistently the same, the FERC is statutorily required to eliminate under and over recovery of money, and the opposition failed ot prove it's case.

FERC Structure

Lauren
Annotation of

As of April 2022 the commissioners include, Commissioner James Danly, Commissioner Allison Clements, Commissioner Mark C. Christie, and Commissioner Willie L. Phillips, and Chairman, Richard Glick. Chairman and Commissioners are appointed by the President and confirmed by the Senate. Commissioners and Chair serve staggered five year terms and not more than three of the five commissioners, including the chair, can be from the same political party. Additional staffers include ~1500 employees (based on FY 2019). Staffers fulfill supplemental positions such as lawyers, engineers, economists, biologist, ecologist etc. The chairman and commissioners are at the top of the organizational structure. Administrative, Regulatory, and Litigation functions all follow. There are 13 specific departments such as the Office of Administrative Litigation, Office of Energy Policy and Innovation, Office of the External Affairs etc. all fall into one of the three functions.

FERC Mission Statement

Lauren
Annotation of

FERC's mission According to the FERC government website: “Assist consumers in obtaining reliable, safe, secure, and economically efficient energy services at a reasonable cost through appropriate regulatory and market means, and collaborative efforts.” This organization as of April 2022 is operational.

8. How has this data resource been critiqued or acknowledged to be limited?

margauxf

The CDC SVI has been acknowledged to be limited in capturing accurate representations of small-area populations that experience rapid change between censuses (e.g. New Orleans in the years following Hurricane Katrina).

The Index is also limited, like other mapping tools, by the lack of homogeneity within any census tract or county/parish. There may very well be more vulnerable communities and individuals living in overall less vulnerable areas. Homeless populations may also specifically not be represented within studies that rely on geocoding by residential address. Length of residence within a geographic area may also impact results.  

The index is also limited by calculations that account for where people live, but not necessarily where they work or play. The lives of individuals are not necessarily restricted to the boundaries of a census tract or county/parish. 

Lastly, vulnerability is only one component of several components that are important for public health officials and policymakers to consider—the hazard itself, the vulnerability of physical infrastructure, and community assets and resources are other elements that must be taken into account for reducing the effects of a hazard.

This data resource has also been critiqued by Bakkensen et al. for not having been explicitly tested and empirically validated to demonstrate that the index performs well (a problem they identify as characterizing multiple indices).

Bakkensen, Laura A., Cate Fox-Lent, Laura K. Read, and Igor Linkov. 2017. “Validating Resilience and Vulnerability Indices in the Context of Natural Disasters.” Risk Analysis 37 (5): 982–1004. https://doi.org/10.1111/risa.12677.

4. What scales (county, regional, neighborhood, census tract) can be seen through this data resource?

margauxf

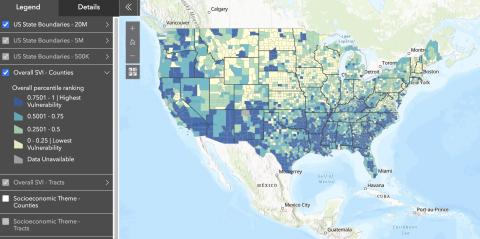
There is a national data set that ranks all counties or census tracts within the entire data set (useful for a multi-state analysis). The user also has the option to utilize a state data set, which ranks counties or census tracts only within the state selected.