Search

Louisiana, US_EiJ Paraconference

Misria

In Louisiana, governing elites have long found it more profitable to deny the connections between health outcomes and the structural inequities of an anti-Black petrostate. Their denial is made possible by the existence of data divergence–that is, inconsistencies between data sets or between a data set and the realities it purports to represent (Encyclopedia of Social Measurement 2005). These inconsistencies range from missing or “undone” (i.e. incomplete or ignored) data (Frickel et al. 2007) to the production of different measures (and the selection of different priorities) by institutional silos. Recognition of the need for public health capacities that address the systems and structures impacting health–especially children’s health–has motivated health equity advocates in Louisiana to fill the data gaps through collaborative datawork, that is, the work of making data meaningful across social and scientific communities. In 2022, a coalition of community organizations, academic researchers, and public health workers led by the Louisiana Center for Health Equity (LCHE), a community-based organization created by a registered nurse, worked together to examine the links between adolescent mental health and disciplinary practices in schools. Ensuring their agendas were informed by community priorities led them to incorporate the contributions of adolescents advocating for better access to physical and mental healthcare resources and the abolishment of discriminatory and punitive disciplinary actions in schools. Their collaborative datawork revealed how data gaps around adolescent mental health are a structuring component of schools’ discriminatory and punitive climates–much as gaps in environmental health data benefit polluting industries. They found that existing figures around adolescent mental health are inaccurate, as many youth are unable to receive an official diagnosis owing to lack of healthcare access. LCHE advocates at a house committee meeting in January 2023 reported that students who exhibit behavioral issues rooted in trauma or mental health more often receive punitive disciplinary actions rather than rehabilitative and restorative services. This work generated the support needed to pass legislation to expand public health infrastructure and access to mental health resources. In June 2023, House Bill 353 authorized the allotment of "mental health days" as an excused absence for students; introduced procedures for schools to connect students to medical treatment and services; and required the Louisiana Department of Education to develop and administer a pilot program for implementing mental health screening, among other changes. By mobilizing advocates and scholars from across the social and institutional silos, LCHE’s collaborative datawork tentatively expanded children’s public health infrastructures. 

Fisher, Margaux. 2023. "Collaborative Datawork and Reframing Adolescent Mental Health in the Deep South." In 4S Paraconference X EiJ: Building a Global Record, curated by Misria Shaik Ali, Kim Fortun, Phillip Baum and Prerna Srigyan. Annual Meeting of the Society of Social Studies of Science. Honolulu, Hawai'i, Nov 8-11.

Overview of Formosa Drainage Study

annika

This supplementary legal document describes recommendations for storm- and waste-water management improvements for the Formosa petrochemical plant in Calhoun County, Texas. The text is a fairly standard drainage assessment. The author describes non-trivial discharge of pollutants out of the plant’s outfalls, which drain into local waters, and the inability of the plant’s systems to prevent flooding from even small storms. For some context on this, it is pretty standard to design a stormwater system to be able to drain the 100-year storm (that is, the storm with a 1% or less chance of occurring in any given year). Formosa’s Texas plant demonstrated the inability to convey even the 2-year storm.

Formosa Drainage Study

annika

Emphases are mine:

Problem areas were identified based on the results from the outfall drainage studies provided by Formosa. Thus, all the results in the OPCC rely on those studies, uncertainities associated with those studies, and the assumptions made for those studies, some of which may or may not be appropriate as I pointed out in Supplement #2 [Page 4]” (3)

“The proposed improvements assume that the conveyance capacity of the problem areas is increased 100%, which would be able to handle twice as much flow that it currently does. The results from the Drainage Study are not conclusive as to what storm event Formosa’s system currently is capable of conveying. The report does mention that the system is not capable of conveying the 2-year storm, and “sometimes” not even the 1-year storm event. (3)

“A 45% contingency is applied to the OPCC due to the uncertainties associated with underground utilities, likelihood of existence of low road crossings and need to replace those, groundwater impacts, other unknowns, and additional costs associated with engineering, etc. 45% is reasonable and in line with industry practices in my experience, especially given the large amount of unknown information available.” (4) 

“My opinion from my July 9, 2018 report that “there have been and are still pellets and/or plastic materials discharges above trace amounts through Outfall 001” is further supported by the deposition testimony of Lisa Vitale, as representative for Freese & Nichols, Inc, that she and her colleagues have seen floating white pellets or small plastic pieces in Lavaca Bay and in the area near outfall 001 as part of her work on the receiving water monitoring program for Formosa’s TPDES permit...Ms. Vitale also testified that she told John Hyak of Formosa about these sightings as well as has sent him water samples with the pellets about five or six times, including at least one time prior to 2010. This, along with the June 2010 EPA Report I cited in my July Report, demonstrates to me that Formosa was aware of problems related to discharges of plastics from its facility since at least in 2010.” (6)


9. How has this data resource been critiqued or acknowledged to be limited?

annlejan7

There are missing data points within the dataset (attributed to non-reported information). This dataset has also been acknowledged to be limited in its prioritization of government data, which could have political limitations that may skew the degree of severity for disasters reported. 

8. What can be demonstrated or interpreted with this data set?

annlejan7

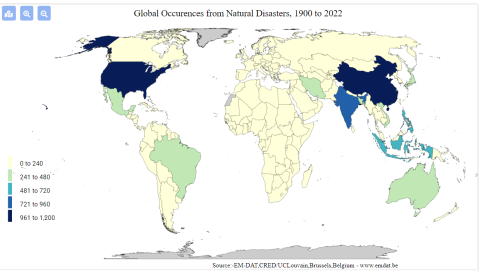
This dataset can be used to demonstrate the geographic distribution of disasters in Vietnam over time. This database recognizes multiple dimensions of disaster, including natural (typhoons, hurricanes), technological (a chemical spill, a factory explosion), and more

Image
screenshot_2022-02-22_171315.png
complex disasters such as famine.

6. How has this data resource been used in research and advocacy?

annlejan7

This resource has been used in a publication written by Hoang et al., 2018 on the economic cost of the Formosa Toxic Waste Disaster in Central Vietnam. It is specifically used within the journal article to highlight the forms in which disasters can take place within a nation, and the rising cases of industrial disasters that have afflicted vulnerable communities within the last decade. This characterization sets the stage and context for the Formosa disaster, and integrates it within a wider conversation about the effects of intensified industrialization on the environment. 

5. What steps does a user need to take to produce analytically sharp or provocative data visualizations with this data resource?

annlejan7

These datasets all involve  a strong spatial component. The presentation of such data could best be done via GIS Software, with their integration within a story map to demonstrate the importance of environmental stewardship to natural environments as well as the people who depend on such resources for their livelihoods.  For example, EPI data can be incorporated with EM-DAT’s disaster data to better understand the relationship between  a country’s EPI performance and the amount of technological disasters it observes. A country’s EPI score on Fish Stock Status can be compared with how much the nation’s GDP relies on fisheries to draw attention to discrepancies between stewardship and a country’s reliance on this resource. This process will require a user to be familiar with GIS Software and spatial plotting of data points (as the datasets themselves have not been integrated into ArcGIS), and using this software to integrate information together into meaningful maps.

4. What data visualizations illustrate how this data set can be leveraged to characterize environmental injustice?

annlejan7

[Source: EM-DAT Public] This graphic shows the prevalence of technological disasters [includes toxic spills, industrial explosions, etc.] by country. This can be used to characterize, on a transnational level, where potential industrial harms are centralized or concentrated. While it does not characterize more insidious harms, such as air pollution, it can be a direct and easy to understand measure of environmental harm distribution across the globe. 

Additionally, data is available as excel sheets, which allows users to produce their own graphics on the prevalence of disasters within a particular nation over a desired time interval. 

3. Who makes this data available and what is their mission?

annlejan7

This was developed in 1988 by personnel from the Center for Research on the Epidemiology of Disasters (CRED) within the Université catholique de Louvain (UCLouvain) with funding from the Belgian government and the World Health Organization (WHO), this data source aims to provide free open access information for users affiliated with academic organizations, non-profits, and international public organizations looking to gain understanding on the distribution  of disaster occurrences around the globe.