Search

Eeyou Itschee (James Bay, Québec)

Misria

Since 1972, Eeyou Itschee, a territory east of James Bay, has been terraformed by the largest hydro-generation system on the planet, led by HydroQuébec and the Government of Québec. A territory 2/3rds the size of France has been diked, dammed, its rivers redirected, and criss-crossed by electrical transmission lines to the South and to the US. Due to the high levels of mercury released by the forests flooded for reservoirs the size of Belgium, health authorities recommend eating no more than two fish from the rivers each month. Fluctuating spring river levels led to the drowning of tens of thousands of Caribou. Learning only from newspapers, the resident Eenouch came together and negotiated the first land claims agreement in Canada, surrendering about 99% of their territory for promises of economic development. 50 years on, a settler-colonial geography, reinforced by a complex sociolegal framework, contain and constrain spatial relations in and of Eeyou Itschee through constant processes of renegotiation and reparation for land with money. Our research focused on a survey of the ways the science literature represents the region and its features. Our research ties with this territory are strongly linked to Nemaska, an Eenouch hamlet 2 days drive north of Montreal that was expropriated but managed to relocate and rebuild their community. Today, a lithium (spodumene) mine is being developed nearby. The community fears the impacts. However, the Nemaska band council approved the project due to the economic benefits it might bring. For more information: https://www.spaceandculture.com/2023/10/31/eeyou-istchee-old-nemaska/ 


Source

Shields, Rob, Cheryl Arnston, Nicholas Hardy and Juan David Guevara-Salamanca. 2023. "Eeyou Itschee and settler colonial terraforming." In 4S Paraconference X EiJ: Building a Global Record, curated by Misria Shaik Ali, Kim Fortun, Phillip Baum and Prerna Srigyan. Annual Meeting of the Society of Social Studies of Science. Honolulu, Hawai'i, Nov 8-11.

Eeyou Itschee (James Bay, Québec)

Misria

Since 1972, Eeyou Itschee, a territory east of James Bay, has been terraformed by the largest hydro-generation system on the planet, led by HydroQuébec and the Government of Québec. A territory 2/3rds the size of France has been diked, dammed, its rivers redirected, and criss-crossed by electrical transmission lines to the South and to the US. Due to the high levels of mercury released by the forests flooded for reservoirs the size of Belgium, health authorities recommend eating no more than two fish from the rivers each month. Fluctuating spring river levels led to the drowning of tens of thousands of Caribou. Learning only from newspapers, the resident Eenouch came together and negotiated the first land claims agreement in Canada, surrendering about 99% of their territory for promises of economic development. 50 years on, a settler-colonial geography, reinforced by a complex sociolegal framework, contain and constrain spatial relations in and of Eeyou Itschee through constant processes of renegotiation and reparation for land with money. Our research focused on a survey of the ways the science literature represents the region and its features. Our research ties with this territory are strongly linked to Nemaska, an Eenouch hamlet 2 days drive north of Montreal that was expropriated but managed to relocate and rebuild their community. Today, a lithium (spodumene) mine is being developed nearby. The community fears the impacts. However, the Nemaska band council approved the project due to the economic benefits it might bring. For more information: https://www.spaceandculture.com/2023/10/31/eeyou-istchee-old-nemaska/ 

Shields, Rob, Cheryl Arnston, Nicholas Hardy and Juan David Guevara-Salamanca. 2023. "Eeyou Itschee and settler colonial terraforming." In 4S Paraconference X EiJ: Building a Global Record, curated by Misria Shaik Ali, Kim Fortun, Phillip Baum and Prerna Srigyan. Annual Meeting of the Society of Social Studies of Science. Honolulu, Hawai'i, Nov 8-11.
9. How has this data resource been critiqued or acknowledged to be limited?

annlejan7

There are missing data points within the dataset (attributed to non-reported information). This dataset has also been acknowledged to be limited in its prioritization of government data, which could have political limitations that may skew the degree of severity for disasters reported. 

8. What can be demonstrated or interpreted with this data set?

annlejan7

This dataset can be used to demonstrate the geographic distribution of disasters in Vietnam over time. This database recognizes multiple dimensions of disaster, including natural (typhoons, hurricanes), technological (a chemical spill, a factory explosion), and more

Image
screenshot_2022-02-22_171315.png
complex disasters such as famine.

6. How has this data resource been used in research and advocacy?

annlejan7

This resource has been used in a publication written by Hoang et al., 2018 on the economic cost of the Formosa Toxic Waste Disaster in Central Vietnam. It is specifically used within the journal article to highlight the forms in which disasters can take place within a nation, and the rising cases of industrial disasters that have afflicted vulnerable communities within the last decade. This characterization sets the stage and context for the Formosa disaster, and integrates it within a wider conversation about the effects of intensified industrialization on the environment. 

5. What steps does a user need to take to produce analytically sharp or provocative data visualizations with this data resource?

annlejan7

These datasets all involve  a strong spatial component. The presentation of such data could best be done via GIS Software, with their integration within a story map to demonstrate the importance of environmental stewardship to natural environments as well as the people who depend on such resources for their livelihoods.  For example, EPI data can be incorporated with EM-DAT’s disaster data to better understand the relationship between  a country’s EPI performance and the amount of technological disasters it observes. A country’s EPI score on Fish Stock Status can be compared with how much the nation’s GDP relies on fisheries to draw attention to discrepancies between stewardship and a country’s reliance on this resource. This process will require a user to be familiar with GIS Software and spatial plotting of data points (as the datasets themselves have not been integrated into ArcGIS), and using this software to integrate information together into meaningful maps.

4. What data visualizations illustrate how this data set can be leveraged to characterize environmental injustice?

annlejan7

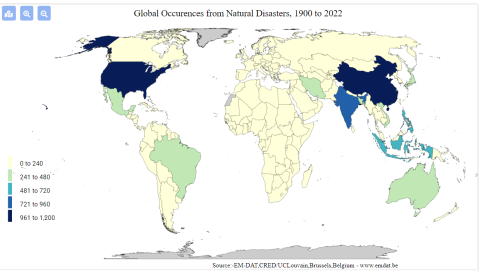
[Source: EM-DAT Public] This graphic shows the prevalence of technological disasters [includes toxic spills, industrial explosions, etc.] by country. This can be used to characterize, on a transnational level, where potential industrial harms are centralized or concentrated. While it does not characterize more insidious harms, such as air pollution, it can be a direct and easy to understand measure of environmental harm distribution across the globe. 

Additionally, data is available as excel sheets, which allows users to produce their own graphics on the prevalence of disasters within a particular nation over a desired time interval. 

3. Who makes this data available and what is their mission?

annlejan7

This was developed in 1988 by personnel from the Center for Research on the Epidemiology of Disasters (CRED) within the Université catholique de Louvain (UCLouvain) with funding from the Belgian government and the World Health Organization (WHO), this data source aims to provide free open access information for users affiliated with academic organizations, non-profits, and international public organizations looking to gain understanding on the distribution  of disaster occurrences around the globe.

2. What data is drawn into the data resource and where does it come from?

annlejan7

The EMT disaster database is compiled from a wide variety of sources, including UN agencies, NGOs, insurance companies, research institutes, and press agencies. The dataset compilation process prioritizes data from UN agencies, the International Federation of Red Cross and Red Crescent Societies, and government agencies. Entries are reviewed prior to consolidation, and this process of checking and incorporating data is done on a daily basis. More routined  data checking and management also occurs at a monthly interval, with revisions made at the end of each year.