Search

Fresno CEC Purpose & Mission

wypark89

Our Purpose

One of our greatest responsibilities is to prepare the next generation to meet the challenges they will face in the 21st Century, with a deep commitment to the rights and responsibilities of U.S. citizenship. We have a unique opportunity for a community dialogue about the civic values, knowledge, and skills that K-12 students should learn and practice in our public school system. We will create strong community support for our schools to provide effective civic education for students to be successful in college, career and citizenship.

OUR MISSION

The mission of the Civic Education Center is to restore civility in America by creating opportunities for youth to learn and practice civic values and democratic skills.

About Us – Civic Ed Center

Civic Education Center | Fresno CA | Facebook

Fresno CEC Summer Institute for Secondary Teachers

wypark89

Goals

  • Teach the vision of the Founders and the triumphs and tragedies of our history.
  • Teach civil dialogue on controversial issues and democratic deliberation.
  • Integrate science, technology, literature, media, arts and math with civic projects.
  • To promote teacher understanding of connections with the State Seal of Civic Engagement, Social Emotional Learning, and Ethnic Studies.

Summer Institute – Civic Ed Center

This image hides vulnerable actors, historical dispossession, and organized resistance

danapowell

This image hides many things, including:

1. the slow but steady dispossession of smallholder (often African-American) farms that have been overtaken/bought out by Smithfield Foods to enlarge the industrial footprint of CAFOs;

2. the hogs themselves, whose hooves never touch the ground as they stand on "hog slats" inside the hangers as they move through the Fordist stages of transformation from individual animals into packaged pork;

3. the human operators, themselves, who are rarely wealthy, and are contracted for decades (or life) to purchase all "inputs" (feed, semen, etc) from Smithfield; in 2010, I took my EJ class from UNC-Chapel Hill to visit one of these operators at his CAFO, outside Raleigh, NC, and he was battling Smithfield and Duke Energy to be allowed to erect and operate a small-scale, experimental wind turbine that ran on methane captured from his pigs; years later, individual efforts at small-scale biogas would be overtaken by entities like Align LNG which now, in Sampson County, proposes the "Grady Road Project" to scale-up factory-farmed methane gas capture from much larger operations;

4. the legacy of resistance to this form of agricultural production, led by community-based intellectuals like Gary Grant, who as early as the 1980s was speaking out, traveling to state and federal lawmakers, publishing, and organizing against the growing harms of CAFOs in his home territory of Halifax County, NC. [See the suggested readings by Gary Grant and Steve Wing, Naeema Muhammed and others, that tracks this organized resistance and the formation of several community-based EJ groups in response].

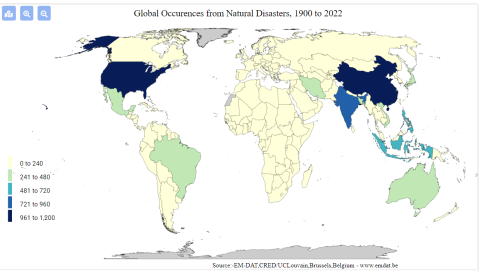
9. How has this data resource been critiqued or acknowledged to be limited?

annlejan7

There are missing data points within the dataset (attributed to non-reported information). This dataset has also been acknowledged to be limited in its prioritization of government data, which could have political limitations that may skew the degree of severity for disasters reported. 

8. What can be demonstrated or interpreted with this data set?

annlejan7

This dataset can be used to demonstrate the geographic distribution of disasters in Vietnam over time. This database recognizes multiple dimensions of disaster, including natural (typhoons, hurricanes), technological (a chemical spill, a factory explosion), and more

Image
screenshot_2022-02-22_171315.png
complex disasters such as famine.

6. How has this data resource been used in research and advocacy?

annlejan7

This resource has been used in a publication written by Hoang et al., 2018 on the economic cost of the Formosa Toxic Waste Disaster in Central Vietnam. It is specifically used within the journal article to highlight the forms in which disasters can take place within a nation, and the rising cases of industrial disasters that have afflicted vulnerable communities within the last decade. This characterization sets the stage and context for the Formosa disaster, and integrates it within a wider conversation about the effects of intensified industrialization on the environment. 

5. What steps does a user need to take to produce analytically sharp or provocative data visualizations with this data resource?

annlejan7

These datasets all involve  a strong spatial component. The presentation of such data could best be done via GIS Software, with their integration within a story map to demonstrate the importance of environmental stewardship to natural environments as well as the people who depend on such resources for their livelihoods.  For example, EPI data can be incorporated with EM-DAT’s disaster data to better understand the relationship between  a country’s EPI performance and the amount of technological disasters it observes. A country’s EPI score on Fish Stock Status can be compared with how much the nation’s GDP relies on fisheries to draw attention to discrepancies between stewardship and a country’s reliance on this resource. This process will require a user to be familiar with GIS Software and spatial plotting of data points (as the datasets themselves have not been integrated into ArcGIS), and using this software to integrate information together into meaningful maps.

4. What data visualizations illustrate how this data set can be leveraged to characterize environmental injustice?

annlejan7

[Source: EM-DAT Public] This graphic shows the prevalence of technological disasters [includes toxic spills, industrial explosions, etc.] by country. This can be used to characterize, on a transnational level, where potential industrial harms are centralized or concentrated. While it does not characterize more insidious harms, such as air pollution, it can be a direct and easy to understand measure of environmental harm distribution across the globe. 

Additionally, data is available as excel sheets, which allows users to produce their own graphics on the prevalence of disasters within a particular nation over a desired time interval. 

3. Who makes this data available and what is their mission?

annlejan7

This was developed in 1988 by personnel from the Center for Research on the Epidemiology of Disasters (CRED) within the Université catholique de Louvain (UCLouvain) with funding from the Belgian government and the World Health Organization (WHO), this data source aims to provide free open access information for users affiliated with academic organizations, non-profits, and international public organizations looking to gain understanding on the distribution  of disaster occurrences around the globe.