Search

California, USA

Misria

In this poster, we share preliminary reflections on the ways in which hermeneutic injustice emerges and operates within educational settings and interactions. Hermeneutic injustice is a type of epistemic injustice that occurs when someone’s experiences are not well understood by themselves or by others, either due to unavailability of known concepts or due to systemic barriers that produce non-knowing (Fricker 2007). In 2021, we entered into a collaborative project to design a high school curriculum on environmental injustice and climate change for California’s K-12 students. Although the project convenors aspired to support the diversity of California’s K-12 student population through representational inclusivity across the program participant, they reproduced essentialized notions of what it means to be an “included subject”. In our first inperson meetings, activities intended to invite difference in the curriculum writing and design community were encountered by participants as an opportunity to point to the margins of that community. Who was in the room and who was not? Initial counts excluded some writers whose identity was not readily apparent by race, ethnicity, or age. Some individuals who, to their consternation, were assumed to be white, revealed themselves as people of color. The project chose the “storyline model” of curriculum design to bring coherence across the teams. The model was developed by science educators to promote student agency and active learning. Lessons start with an anchoring phenomenon, which should hook students and produce enough questions to sustain inquiry cycles that culminate in consensus making. As a result, each grade-level unit of our curriculum was intended to focus on a single environmental phenomenon, like wildfire. However, informed by Gregory Bateson’s theory of learning, we sought to foreground complexity by recursively analyzing environmental injustice through case study analysis of many hazards, injustices, and places. It took multiple meetings over several months to arrive at an articulation of environmental injustice as our central phenomenon that recognizes the compounding impacts of both climate change and toxic pollution. It also required restructuring the working relationships between the project's administrative arm, the curriculum consultants, and the writing team. The image we include is a photograph of an exercise done together with another HS team as we were tasked to clarify the aims and goals of our imagined lessons. As is evidenced in the photograph, each writing team found it difficult to articulate learning outcomes as a series of checklists, or goals, separate from skill-development that represented the dynamic need for curriculum capable of examining climate change and the environmental justice needs for California’s students.

Tebbe, Margaret, Tanio, Nadine, and Srigyan, Prerna. 2023.  "Reflections on Hermeneutical Injustice in K-12 Curriculum Development." In 4S Paraconference X EiJ: Building a Global Record, curated by Misria Shaik Ali, Kim Fortun, Phillip Baum and Prerna Srigyan. Annual Meeting of the Society of Social Studies of Science. Honolulu, Hawaii, Nov 8-11.

7. How has this data resource been used in research and advocacy?

margauxf

The SVI has been used to assess hazard mitigation plans in the southeastern US, evaluate social vulnerability in connection to obesity, explore the impact of climate change on human health, create case studies for community resilience policy, and even to look beyond disasters in examining a community’s physical fitness. 

The SVI was also used by public health researchers to explore the association between vulnerability and covid-19 incidence in Louisiana Census Tracts. Previous research examining associations between the CDC SVI and early covid-19 incidence had mixed results at a county level, but Biggs et al.’s study found that all four CDC SVI sub-themes demonstrated association with covid-19 incidence (in the first six months of the pandemic). Census tracts with higher levels of social vulnerability experienced higher covid-19 incidence rates. Authors of this paper point to the long history of racial residential segregation in the United States as an important factor shaping vulnerability and covid-19 incidence along racialized lines, with primarily Black neighborhoods typically most disadvantaged relative to primarily white neighborhoods. The compounding factors shaping vulnerability along racialized lines—high rates of poverty, low household income, and lower educational attainment—are identified as shaping the likelihood of covid-19 infection. The authors encourage policy initiatives that not only mitigate covid-19 transmission through allocation of additional resources and planning, but that also “address the financial and emotional distress following the covid-19 epidemic among the most socially vulnerable populations” (Biggs et al., 2021).

Image
relationship between social vulnerability and covid-19 Louisiana

Biggs, Erin N., Patrick M. Maloney, Ariane L. Rung, Edward S. Peters, and William T. Robinson. 2021. “The Relationship Between Social Vulnerability and COVID-19 Incidence Among Louisiana Census Tracts.” Frontiers in Public Health 8. https://www.frontiersin.org/article/10.3389/fpubh.2020.617976.

Lehnert, Erica Adams, Grete Wilt, Barry Flanagan, and Elaine Hallisey. 2020. “Spatial Exploration of the CDC’s Social Vulnerability Index and Heat-Related Health Outcomes in Georgia.” International Journal of Disaster Risk Reduction 46 (June): 101517. https://doi.org/10.1016/j.ijdrr.2020.101517.

8. How has this data resource been critiqued or acknowledged to be limited?

margauxf

The CDC SVI has been acknowledged to be limited in capturing accurate representations of small-area populations that experience rapid change between censuses (e.g. New Orleans in the years following Hurricane Katrina).

The Index is also limited, like other mapping tools, by the lack of homogeneity within any census tract or county/parish. There may very well be more vulnerable communities and individuals living in overall less vulnerable areas. Homeless populations may also specifically not be represented within studies that rely on geocoding by residential address. Length of residence within a geographic area may also impact results.  

The index is also limited by calculations that account for where people live, but not necessarily where they work or play. The lives of individuals are not necessarily restricted to the boundaries of a census tract or county/parish. 

Lastly, vulnerability is only one component of several components that are important for public health officials and policymakers to consider—the hazard itself, the vulnerability of physical infrastructure, and community assets and resources are other elements that must be taken into account for reducing the effects of a hazard.

This data resource has also been critiqued by Bakkensen et al. for not having been explicitly tested and empirically validated to demonstrate that the index performs well (a problem they identify as characterizing multiple indices).

Bakkensen, Laura A., Cate Fox-Lent, Laura K. Read, and Igor Linkov. 2017. “Validating Resilience and Vulnerability Indices in the Context of Natural Disasters.” Risk Analysis 37 (5): 982–1004. https://doi.org/10.1111/risa.12677.

4. What scales (county, regional, neighborhood, census tract) can be seen through this data resource?

margauxf

There is a national data set that ranks all counties or census tracts within the entire data set (useful for a multi-state analysis). The user also has the option to utilize a state data set, which ranks counties or census tracts only within the state selected.

10. What steps does a user need to take to produce analytically sharp/provocative data visualizations with this data resource?

margauxf

Users must select the ranking variable for either the overall vulnerability index score or for one of the four sub themes: Socioeconomic Status, Household Composition & Disability, Minority Status & Language, or Housing Type & Transportation.

A dictionary of terms used in this data resource are available at the bottom of this webpage: https://www.atsdr.cdc.gov/placeandhealth/svi/documentation/SVI_documentation_2018.html.

5. What can be demonstrated or interpreted with this data set?

margauxf

The CDC/ADSDR SVI is designed to help public health officials and local planners with preparing and responding to emergency events like hurricanes, disease outbreaks, or exposure to dangerous chemicals. The SVI databases and maps can be used to estimate the amount of supplies need (e.g. food, water, medicine, etc.), to identify areas in need of emergency shelters, to estimate the number of emergency personnel need, to create evacuation plans, and to “identify communities that will need continued support to recover following an emergency or natural disaster” (https://www.atsdr.cdc.gov/placeandhealth/svi/fact_sheet/fact_sheet.html).

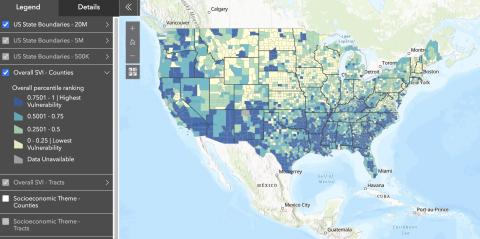
The SVI determines the social vulnerability of every census tract in the United States. The index ranks each tract on 15 factors grouped into four related themes (see below).

Each census tract/county has a percentile ranking that represents the proportion of tracts/counties for which the tract/county of interest is equal to or lower in terms of social vulnerability. Higher percentile ranking values indicate greater vulnerability. For instance, ranking of 0.85 indicates that the tract/county of interest is more vulnerable than 85% of tracts/counties but less vulnerable than 15% of tracts/counties.

The CDC defines social vulnerability as the extent to which certain social conditions might affect a community’s capacity to respond to a disaster and prevent human suffering and financial loss.

Starting in 2014, the CDC has also added a database for Puerto Rice, as well as for Tribal Census Tracts, which are defined independently of standard county-based tracts.

Overall Vulnerability

1. Socioeconomic Status

  • Below Poverty
  • Unemployed
  • Income
  • No High School Diploma

2. Household Composition and Disability

  • Aged 65 of Older
  • Aged 17 or Younger
  • Civilian with a Disability
  • Single-Parent Household

3. Minority Status and Language

  • Minority
  • Speaks English “Less than Well”

4. Housing Type and Transportation

  • Multi-Unit Structures
  • Mobile Homes
  • Crowding
  • No Vehicle
  • Group Quarters

In 2018, two adjunct variables (not included in the overall SVI rankings) were added: 2014-2018 ACS estimates for persons without health insurance, and an estimate of daytime population taken from LandScan 2018.

2. Who makes this data available and what is their mission?

margauxf

This data is made available by the CDC Agency for Toxic Substances and Disease Registry (ATSDR) and more specifically the Geospatial Research, Analysis, and Services Program (GRASP), a team of public health and geospatial science, technology, visualization, and analysis experts. Their mission is to provide leadership, expertise, and education in the application of geography, geospatial science, and geographic information systems (GIS) for public health research and practice.