Search

What quotes from this text are exemplary or particularly evocative?

margauxf

“The large question this study addresses is the following: How do people make sense of (and cope with) toxic danger? The Martinezes’ story anticipates the complexity of the answer(s): physical and psychological suffering is compounded by doubts, disagreements, suspicions, fears, and endless waiting.” (4)

‘Flammable is a story of people’s confusion, mistakes and/or blindness regarding the toxicity that surrounds them. Flammable is also a story of silent habituation to contamination and of almost complete absence of mass protest against toxic onslaught’ (4)

“Schoolteachers, journalists, and lawyers are also part and parcel of daily life in Flammable. Together, all these actors contribute to what Flammable residents know about their place. They also influence what they ignore, what they want to know, and what they misrecognize. Government officials, company personnel, physicians, teachers, journalists, and lawyers jointly (but hardly cooperatively, given that their opinions don’t count equally) shape locals’ experiences of contamination and risk. This book examines how and why this production of shared knowledge (or lack thereof ) occurs.” (5)

“All in all, confusions, bewilderments, divisions, rumors, frustrations, and hopes are making Flammable residents wait—they wait for more testing, for further and better knowledge, for relocation, and for the “huge” settlement with one of the “powerful companies” that will, in the words of a neighbor, “allow us to move out.” This waiting is, as we will show, one of the ways in which Flammable residents experience submission.” (6) 

“We did our best to learn how to listen, look, and touch with respect and care, knowing with Nancy Scheper-Hughes (1992:28) that “seeing, listening, touching, recording, can be, if done with care and sensitivity, acts of fraternity and sisterhood, acts of solidarity. Above all, they are the work of recognition. Not to look, not to touch, not to record, can be the hostile act, the act of indifference and of turning away.” (14)

‘… the culture of toxic uncertainty is a complex web of meanings and shared understandings’ (108)

What concepts does this text build from and advance?

margauxf

Labor of confusion: “During the long period of slowly germinating contamination, the actions of government authorities toward pollution in the neighborhood were less consistent and more contradictory than either the denial or underestimation that has been documented in the existing literature. Those multiple incongruous actions gave shape to what we term, extending the insights of students of ideology and symbolic power (Thompson 1984; Eagleton 1991; Bourdieu 1991), a labor of confusion that has a decisive effect on shared (mis)understandings.” (10)

 Ulrich Beck, social invisibility, lack of “social thinking” about environmental issues (Beck 1992)

Bourdieu, symbolic violence - misrecognition of power structures on part of the oppressed enables domination

Toxic uncertainty: “a way of experiencing toxic suffering that is shaped by what we call, borrowing from Charles Tilly (1996), the interacting “invisible elbows” of external power forces and of everyday routine survival struggles” (6)


What is the main argument, narrative and effect of this text? What evidence and examples support these?

margauxf

Flammable is an account of how people in a particular place make sense of slow, invisible environmental pollution. The people of Flammable live in an Argentinean shantytown located next to petrochemical companies and storage facilities. They have been deeply affected by the rise in unemployment in the 1990s, with most residents subsisting on part-time manual jobs at one of the companies, retirement pensions, state welfare programmes and what else they can find. The area in which these residents live is known and recognized by government experts to be contaminated and unsafe for human habitation–and yet widespread confusion and uncertainty amongst residents and a lack of government actions means that the shantytown continues to exist. Auyero and Swistun explore the multitude of influences that ‘‘shape what people see, what they don’t see, what they know, what they don’t know, and what they would like to know, what they do and what they don’t do’’ (145). They show how residents gradually naturalize their situations, which, combined with the mystification of dominant discourses, contributes to their quiescence in the face of contamination. 

7. How has this data resource been used in research and advocacy?

margauxf

The SVI has been used to assess hazard mitigation plans in the southeastern US, evaluate social vulnerability in connection to obesity, explore the impact of climate change on human health, create case studies for community resilience policy, and even to look beyond disasters in examining a community’s physical fitness. 

The SVI was also used by public health researchers to explore the association between vulnerability and covid-19 incidence in Louisiana Census Tracts. Previous research examining associations between the CDC SVI and early covid-19 incidence had mixed results at a county level, but Biggs et al.’s study found that all four CDC SVI sub-themes demonstrated association with covid-19 incidence (in the first six months of the pandemic). Census tracts with higher levels of social vulnerability experienced higher covid-19 incidence rates. Authors of this paper point to the long history of racial residential segregation in the United States as an important factor shaping vulnerability and covid-19 incidence along racialized lines, with primarily Black neighborhoods typically most disadvantaged relative to primarily white neighborhoods. The compounding factors shaping vulnerability along racialized lines—high rates of poverty, low household income, and lower educational attainment—are identified as shaping the likelihood of covid-19 infection. The authors encourage policy initiatives that not only mitigate covid-19 transmission through allocation of additional resources and planning, but that also “address the financial and emotional distress following the covid-19 epidemic among the most socially vulnerable populations” (Biggs et al., 2021).

Image
relationship between social vulnerability and covid-19 Louisiana

Biggs, Erin N., Patrick M. Maloney, Ariane L. Rung, Edward S. Peters, and William T. Robinson. 2021. “The Relationship Between Social Vulnerability and COVID-19 Incidence Among Louisiana Census Tracts.” Frontiers in Public Health 8. https://www.frontiersin.org/article/10.3389/fpubh.2020.617976.

Lehnert, Erica Adams, Grete Wilt, Barry Flanagan, and Elaine Hallisey. 2020. “Spatial Exploration of the CDC’s Social Vulnerability Index and Heat-Related Health Outcomes in Georgia.” International Journal of Disaster Risk Reduction 46 (June): 101517. https://doi.org/10.1016/j.ijdrr.2020.101517.

8. How has this data resource been critiqued or acknowledged to be limited?

margauxf

The CDC SVI has been acknowledged to be limited in capturing accurate representations of small-area populations that experience rapid change between censuses (e.g. New Orleans in the years following Hurricane Katrina).

The Index is also limited, like other mapping tools, by the lack of homogeneity within any census tract or county/parish. There may very well be more vulnerable communities and individuals living in overall less vulnerable areas. Homeless populations may also specifically not be represented within studies that rely on geocoding by residential address. Length of residence within a geographic area may also impact results.  

The index is also limited by calculations that account for where people live, but not necessarily where they work or play. The lives of individuals are not necessarily restricted to the boundaries of a census tract or county/parish. 

Lastly, vulnerability is only one component of several components that are important for public health officials and policymakers to consider—the hazard itself, the vulnerability of physical infrastructure, and community assets and resources are other elements that must be taken into account for reducing the effects of a hazard.

This data resource has also been critiqued by Bakkensen et al. for not having been explicitly tested and empirically validated to demonstrate that the index performs well (a problem they identify as characterizing multiple indices).

Bakkensen, Laura A., Cate Fox-Lent, Laura K. Read, and Igor Linkov. 2017. “Validating Resilience and Vulnerability Indices in the Context of Natural Disasters.” Risk Analysis 37 (5): 982–1004. https://doi.org/10.1111/risa.12677.

4. What scales (county, regional, neighborhood, census tract) can be seen through this data resource?

margauxf

There is a national data set that ranks all counties or census tracts within the entire data set (useful for a multi-state analysis). The user also has the option to utilize a state data set, which ranks counties or census tracts only within the state selected.

10. What steps does a user need to take to produce analytically sharp/provocative data visualizations with this data resource?

margauxf

Users must select the ranking variable for either the overall vulnerability index score or for one of the four sub themes: Socioeconomic Status, Household Composition & Disability, Minority Status & Language, or Housing Type & Transportation.

A dictionary of terms used in this data resource are available at the bottom of this webpage: https://www.atsdr.cdc.gov/placeandhealth/svi/documentation/SVI_documentation_2018.html.

5. What can be demonstrated or interpreted with this data set?

margauxf

The CDC/ADSDR SVI is designed to help public health officials and local planners with preparing and responding to emergency events like hurricanes, disease outbreaks, or exposure to dangerous chemicals. The SVI databases and maps can be used to estimate the amount of supplies need (e.g. food, water, medicine, etc.), to identify areas in need of emergency shelters, to estimate the number of emergency personnel need, to create evacuation plans, and to “identify communities that will need continued support to recover following an emergency or natural disaster” (https://www.atsdr.cdc.gov/placeandhealth/svi/fact_sheet/fact_sheet.html).

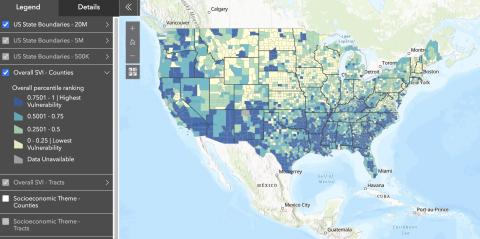
The SVI determines the social vulnerability of every census tract in the United States. The index ranks each tract on 15 factors grouped into four related themes (see below).

Each census tract/county has a percentile ranking that represents the proportion of tracts/counties for which the tract/county of interest is equal to or lower in terms of social vulnerability. Higher percentile ranking values indicate greater vulnerability. For instance, ranking of 0.85 indicates that the tract/county of interest is more vulnerable than 85% of tracts/counties but less vulnerable than 15% of tracts/counties.

The CDC defines social vulnerability as the extent to which certain social conditions might affect a community’s capacity to respond to a disaster and prevent human suffering and financial loss.

Starting in 2014, the CDC has also added a database for Puerto Rice, as well as for Tribal Census Tracts, which are defined independently of standard county-based tracts.

Overall Vulnerability

1. Socioeconomic Status

  • Below Poverty
  • Unemployed
  • Income
  • No High School Diploma

2. Household Composition and Disability

  • Aged 65 of Older
  • Aged 17 or Younger
  • Civilian with a Disability
  • Single-Parent Household

3. Minority Status and Language

  • Minority
  • Speaks English “Less than Well”

4. Housing Type and Transportation

  • Multi-Unit Structures
  • Mobile Homes
  • Crowding
  • No Vehicle
  • Group Quarters

In 2018, two adjunct variables (not included in the overall SVI rankings) were added: 2014-2018 ACS estimates for persons without health insurance, and an estimate of daytime population taken from LandScan 2018.