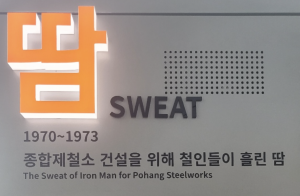
Pohang: POSCO Museum
Photo essay of wall text of POSCO Museum of Pohang

Photo essay of wall text of POSCO Museum of Pohang

XXX

this diagram represents poverty rates from 15 years ago. this is the history of newarks poverty rates towards families children and more.
The policy is to have stronger land use and environmental rules on a local level. It aims to mitigate use of pollutants, and give careful attention to low-income, minority citizens as to not pollute their communities.
In the article, the authors used data from the 2011-2015 American Community 5-Year Estimates by the U.S. Census, 2010 U.S Census, and George C. Galster, “The Mechanism(s) of Neighborhood Effects: Theory, Evidence, and Policy Implications.”. They looked at data follwing children under 18, and followed poverty trends such as census tracts for concentrated areas of high poverty. They used the number of children in Essex County Cities and compared it to the the amount of children in poverty in those cities, for the years of 2000 and 2015. Henceforth, they created an arguement stating that Child Poverty rates have risen within those 15 years, and even by 50% in some areas. The only issue I have with some of this data is that in some cities, we see a decrease in child population - and while there is an increase in child poverty in those areas, I feel like the reduced number of children in that area plays a big part in the so called "Increased Child Poverty Rates".
This article from 2009 focuses on the controversy of a garbage incenerator in the Ironbound that has sparked civil engagements to make the facility practice clean emmisions. Despite their reports of emmision reductions in 2005, the community argued that the garbage incenereator looked over many occassions where they violated those regulations, and how it still effects those communities. Here we see how the governments and people's interest don't line up.
this diagram shows how different age groups suffer from povert. as the years in age grow larger, the higher the numbers in poverty.
this graph is a perfect representation of the affects any thing can have on communities. this graph can be correlated with things like natural disasters and their would be an increase in numbers.
This initiative by the ICC to ground the history of Environmental Justice in Newark, while creating resilience through education and powerful messages.