Test project Heidi
In the spirit of life long learning
Testproject DM
Welcome to Daniel's testproject
Test project Pesticides and Protection Tanzania
testing out building a project
The Red Spot
The 2008 financial crisis was one of the biggest shifts of wealth away from the Black community.
pece_annotation_1473037830
a_chenDue to the mass destruction of the area, the first few days’ data were not able to collect (not only the destruction, but the rescue was the first priority). Therefore, the scientific committee used models to simulate and analyse the data (might not be accurate on the early stage). After the rescue, many countries have provided data to assist the works. For the long‐live radioactive substances, the data was able to collect with the ground soils. Furthermore, prediction can be made with the pass experiences and the basic models.
pece_annotation_1473630164
a_chenThe received data can be managed and visualised into charts or map tiles (e.g. open street maps or satellite maps). The data is visualized in the panel of “Visualize Your Story “with four modes of visual features.
- Branded Deployment
- Map Mode
- Timeline Mode
- Activity Analytics Mode
pece_annotation_1474235804
a_chen“… the murders occurred where it all began — in the remote forests of southeast Guinea, where superstition overwhelms education and whispers of Ebola stoke fear and sometimes violence.”
“The increase in violence marks a new dark chapter in the fight against Ebola…”
pece_annotation_1474297589
a_chenSince the article reported that this is the fourth edition of the design, most of the problems are solved during the refurbishment of product. So there are not many problems with the design as they tested with the publics. But they plan to make the bridge “stronger, longer, lighter, more compact and quicker to set up”.


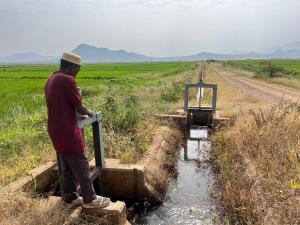
the rice irrigation scheme, Pare Valley, Tanzania