Visualizing Geita
xxxx

xxxx

children were tested for lead poisoning and their was a correlation between those who had lead poisoning and those who were homeless or a victim to poverty.
charts like this only show how any are in poverty. whats not shown is how these people and families got to this point and what the common theme is between them
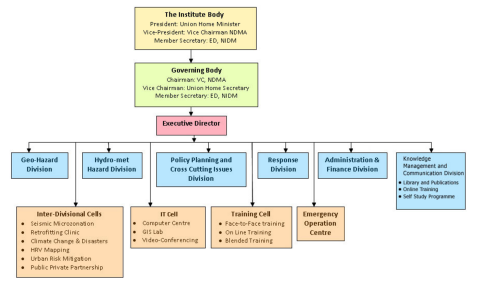
The Disaster Management Act of 2005 constitutes the responsibilites of the NIDM to be human resource development, capacity building, training, research, documentation and policy advocacy in the field of disaster management. The organization aims to promote disaster management as a high priority in the national goverment. They also aspire to create "a culture of prevention" pertaining to disasters that involves all stakeholders.
this diagram represents poverty rates from 15 years ago. this is the history of newarks poverty rates towards families children and more.
this diagram shows how different age groups suffer from povert. as the years in age grow larger, the higher the numbers in poverty.
The Minister of Home Affairs acts as the President, and the Vice Chairman of the NDMA (National Disaster Management Authority) acts as Vice President. The body of the organiation is comprised of 42 members including secretaries of nodal Ministries and Departments of Government of India and State Governments, the heads of national scientific, research and technical organizations, and eminent scientists and practioners. The governing body of the organization, which runs its day to day operations, is comprised of 16 members, and is chaired by the Vice Chairman of the NDMA, with the Secretary of Home Affairs acting as the Vice President.

this graph is a perfect representation of the affects any thing can have on communities. this graph can be correlated with things like natural disasters and their would be an increase in numbers.
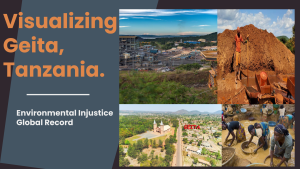
Artisanal or Snall Scale Mining in Geita.